 10:03:00 ص
Optimizing well placement to eliminate water poverty
How data visualization is helping Water for Good bring fresh water to the Central African Republic
Madina Fanette has always had a passion for cooking. After years of culinary training, she’s made this dream her livelihood. Today, she owns and operates a restaurant from her front yard in Berbérati, the second-largest city in the Central African Republic (CAR). She brings in hungry locals for her fresh fish, beef dishes and her popular Saturday soup. While she currently experiences great success, her entrepreneurial journey has been anything but easy.
Fanette fled the country in 2012 during civil war, lived in refugee camps for five years and worked most of that time in food service before returning to the CAR to open her own restaurant in 2017.
Water for Good, a nonprofit that aims to end water poverty in the CAR, has helped provide Berbérati and other cities with clean water wells. Analytics and data visualization have played an important role in these efforts to ensure that others like Fanette have water for cooking and cleaning while also protecting the lives of thousands of citizens from deadly water-related diseases.
Fanette has found a niche serving delivery meals and wedding cakes, but the difficulties of living in a developing country still affect her livelihood. She does not own a stove, so her cooking is done over a charcoal fire. She also can’t freeze food because there is not enough reliable electricity. But thanks to Water for Good, the one thing she no longer has to worry about is reliable access to clean water.

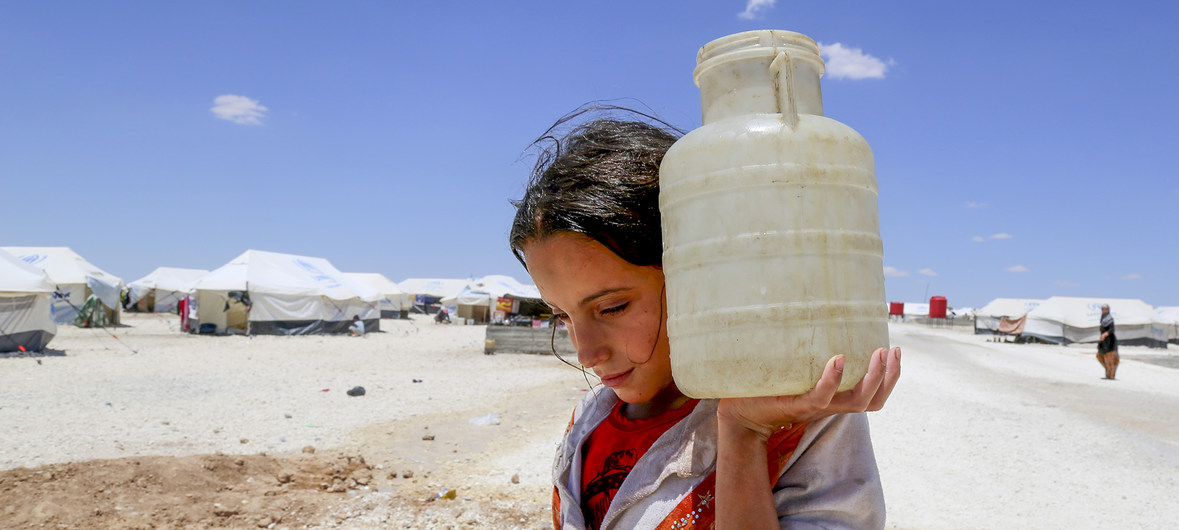
Water for Good focuses entirely on the CAR – the second-poorest country in the world, with income per capita reaching only $750 per year. While the average American uses 100 gallons of water per day – the highest rate in the world – the average person in the CAR uses just five gallons per day, and often this water is not even safe to drink.
Water poverty forces women primarily to spend hours a day fetching clean water, taking away time from work, family and education. A lack of clean water can also lead to sickness and death.
According to UNICEF, children under 5 in more than a dozen conflict-affected countries are on average 20 times more likely to die from illnesses linked to unsafe water and bad sanitation than from war.
Water for Good aims to address this tragedy by drilling clean water wells and creating systems to maintain them for long-term success. It connects communities to locally owned water businesses, a supply of spare parts and government oversight to ensure functional projects and self-sufficiency within the community.
To achieve its goals of eliminating water poverty in particularly underserved regions of the CAR and eventually in the entire country by 2030, the nonprofit had to better understand the status of its existing wells and determine the optimal locations to drill new ones. Water for Good turned to advanced analytics to find the answers it needed.
Water for Good drills clean water wells and creates systems to maintain them for long-term success. It connects communities to locally owned water businesses, a supply of spare parts and government oversight to ensure functional projects and self-sufficiency within the community.
Optimizing well placement
By July 2019, 80% of the population in the region of Mambéré-Kadéï, where Berbérati is located, had access to clean water. With the goal of serving 100% of this particular region by 2020, Water for Good knew it needed to plan strategically for drilling new wells. But determining the best locations becomes complicated quickly, depending on a number of data points:
Existing well locations.
Maintenance records on existing wells.
Usage rates for existing wells.
Natural water access locations.
Population size and the needs of different villages.
Village preparedness levels for new pumps to ensure the pump is successful.
A team of SAS volunteers created a custom dashboard that overlays many of these key data points on one map so Water for Good workers can see the overall big picture of water access in the area. The dashboard, which was built using SAS® Visual Analytics, helps Water for Good better understand the quality of existing wells and make smarter decisions about where to drill new wells.
“The analysis of our data really helped us to think about the next phases of our data visualization methods,” Water for Good CEO Jon Allen said. “We aim to reach everyone in the Central African Republic with clean water, and it is important to properly visualize the population’s water needs for planning our operations and coordinating with the government and other organizations at the national level.”

The dashboard provides vital information, including the functionality of each existing pump through different colors on the map, allowing for quick identification of pump maintenance issues.
The map also displays overdemand levels to represent the people who do not have easy access to water. This is important because some locations with access to a natural water source may not have as critical a need for a new well.
The visualization also displays a crucial metric called “pump preparation level.” This is an aggregate of different political values that indicate whether the community is ready to receive a well, including the support of each village chief and the stability of the population based on survey data. Water for Good users can drill down further into this metric to see text fields with notes from volunteers. For example, volunteers could note places with populations fleeing from recent military attacks. This lets the Water for Good team know that there’s likely not a large population at this location, so it is not ideal to invest in placing a well there.
The SAS team suggested where new pumps should go based on these factors, marking the exact locations clearly on the visualization. This, coupled with a simple dashboard that highlights the total cost and total number of new beneficiaries for each pump, allows the Water for Good team to act quickly and strategically. And it can share the data with others who need it.
“Now we can more easily share the level of water need in these communities with the local government and funders too,” said Allen.
Collecting population data
While the first phase of the project helped Water for Good with reporting and optimization needs, the second phase aimed to help the organization collect more accurate population data in the CAR.
Because there is limited census data available for the CAR, Water for Good has had to manually collect population data over the years, which can be tedious and imprecise. For this next project, a new SAS volunteer team used satellite data from public online sources to supplement the manually collected census data from the organization.
By using a data set that combined both Water for Good and satellite data, the team identified locations of overlap between the two data sources. When the organization mapped it out with SAS Visual Analytics, Water for Good could easily see the total difference in population estimates between the two data sources.
Population data is crucial for choosing the ideal water solution for each area – whether that’s a solar tank system for larger populations or a foot or hand pump for smaller populations.
“This is a level of complex analysis that we would not have been able to do on our own,” Allen said. “SAS gave us a better sense of the reliability of this data as we plan for projects in the future.”
As a result, Madina Fanette and millions of others like her can now have water for their businesses, their families and their communities.
Advanced analytics helps Water for Good better serve people like Madina Fanette and millions of others across the CAR. Custom visualizations built from thousands of data points give the nonprofit organization a clear understanding of its current progress and how to best allocate resources for the future. Water for Good can make more data-driven decisions to best provide clean, lasting water to all, propelling it closer to its goal of eliminating water poverty in the Central African Republic by 2030.
ليست هناك تعليقات
إرسال تعليق